In the last post we talked briefly about both Incidence and Prevalence.
Quick recap
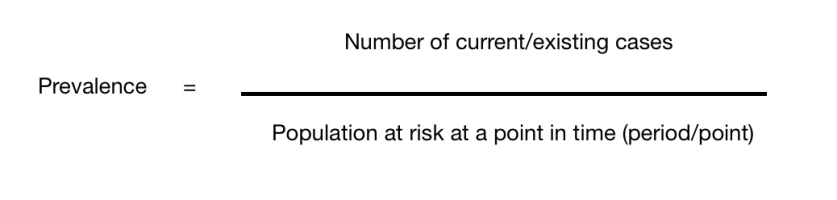
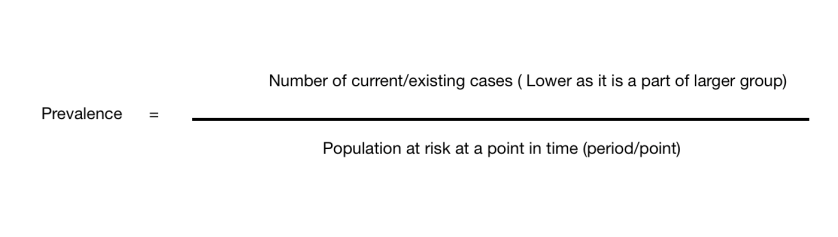
Prevalence is the number of incidents/cases/chocolate that are already in the population/box of chocolates at that point in time.
Occasionally it is called Point Prevalence. This is to let us know that the prevalence is being measured over a single point if time, versus a period of time (weeks – months)
Period Prevalence – Prevalence measured over weeks/months
Given that prevalence represents a part of a whole group, it can never be more than 1 when expressed as an equation.
Prevalence is basically a useful tool in giving us an initial idea of the extent of a disease/outcome. However if does not tell us how many new cases take place, how often this particular outcome happens, how long the disease/outcome lasts and what the risk factors are.
Given that it is election time that will be my example.
So Blythe Valley typically was a Labour safe seat. And the labour party held a majority based on the last election (point of time). However, this does not take into consideration the new voters who voted Conservative or the people who changed their mind and voted Conservative in this election.
Measuring disease and health outcomes, Part 1 – Frequency
How do we measure how often a particular disease happens in a population? How do we identify which diseases are more far-reaching or have the worst outcomes? How do we decide at what level we should intervene?
By knowing the frequency.
Frequency guides us by telling us how often an event happens in a particular population over a specific time. It helps us understand how a disease affects a population or rather the health outcomes by measuring it.
To do this we have to clearly identify what we are looking for and this is called a case definition. This is because not all health outcomes or diseases are black and white, therefore having a clear cut-off point helps us measure how many people are affected by it. For example, if we want to see how many obese people are in a community our case definition would be to look for people with a BMI > 30. It can go beyond clinical issues such as looking at the number of people over the age of 60 who had fallen in the last month. In the latter, the case could occur once or even more than that.
Basically by getting a clear definition. We are able to identify the individuals in the population.
However, knowing the frequency of an event can be misleading as population size can affect our perception of it. For example, if I said there were 200,000 known diabetics in London and 50,000 in Hull City. You would think that Hull had fewer diabetics, right? Now, what if I told you that the population of London is 8 million people while Hull only has 200,000 people. Does that change your mind?
This is why we need to know the population and identify the population at risk.
When we think about the healthcare system, there is often one aspect of care we do not talk about – YOU!
The fact is that every individual plays a rather significant role and I don’t just mean in terms of a being a recipient of healthcare services, a patient or working as a trained healthcare professional. I mean everyday people providing an element of service.
This is known as lay care.
It basically consists of self care, caring for a family member, giving advice, sharing information, emotional support and even volunteering. In fact it accounts for about 80% of all care and is rooted in every form of formal healthcare.
From the time we were children from our parents looking after us when we are ill, asking for advice from family and friends when we have any health issues, seeking over the counter pain relief to making the decision to go into hospital – all these are forms of lay care. Another big aspect is from volunteers providing a listening ear and emotional support to carers looking after the elderly/disabled/sick children. It must be mentioned that in most contexts, it is unpaid care/work.
As an intern in the Geriatric ward in Sabah, I recall not always being able to discharge medically stable inpatients. Why? Because they were unable to care for themselves nor were their families equipped to do so. This led to prolonged hospital stay, additional costs and a whole set of issues for the carer such as potential loss of income, issues at work and additional stresses to the individual. Thus begging the question of what services may need to be made available to address these needs and at a higher level perhaps even policies.
Why is it so important for formal healthcare to understand the reach of lay care?
It’s important because it is supplementary to formal healthcare at all levels. It gives us insight into the understanding of illness in the community, when people will seek healthcare, who they are comfortable seeking it from, as well as how changing times and socio-economics is causing a shift in the ability of ordinary people to provide care. This information is crucial in designing our healthcare services, identifying areas we need to improve on and expanding services accordingly.
I would love to hear about your experiences in providing lay care or where it is being provided. Do you think this has changed over time or do you see it changing? What do you think could be done in those instances.
Today, as I clicked and read posts on World AIDS Day all across social media and the news, I realised that while it is part and parcel of my training to know about HIV/AIDs and the clinical aspects of it. I realised I did not know nearly enough about the history and how we have progressed over the years especially in public health terms.
So, I spent most of the day reading up on it.
What I have come to learn is that unlike many other epidemics or diseases, we as human beings could have dealt with this better. The WHO states that ‘Fear, stigma and ignorance’ were the main drivers of this disease. While I cannot blame fear at the very beginning because we lacked knowledge, information and we were driven by the fear to survive. Our failings came to the forefront when we identified the groups at risk and it being spread by sexual contact.
Essentially stigma stopped us from being able to apply the usual standards of disease control. It is appalling to think that fear, stigma and the ability to assign some form of fault/prejudice were such driving forces that we had to change our approach.
Thankfully, things have changed and we are at a point in time where there is a commitment globally to end it as a public health threat by the year 2030. The methods being used are improving identification by expanding testing, simplifying treatment as well as monitoring and of course pushing for prevention which has been demonstrated by ’low-income countries’ to be effective. One such example is how Ugandans have managed to half the rate of infections over a ten-year period by pushing for education and prevention methods.
While, there is still a lot to do. I think my take home message while not strictly a pubic health one today – is that we as people need to try hate a little less and not be afraid of difference. Perhaps things could have been easier if we as human beings could believe that regardless of circumstances everyone had the right to life.
I have linked some of articles below if you would like to have a read.
In my last post, I talked about what descriptive and analytical studies are. I also mentioned what types of studies fall under these two categories.
Always easier to visualise. No?
So quick recap
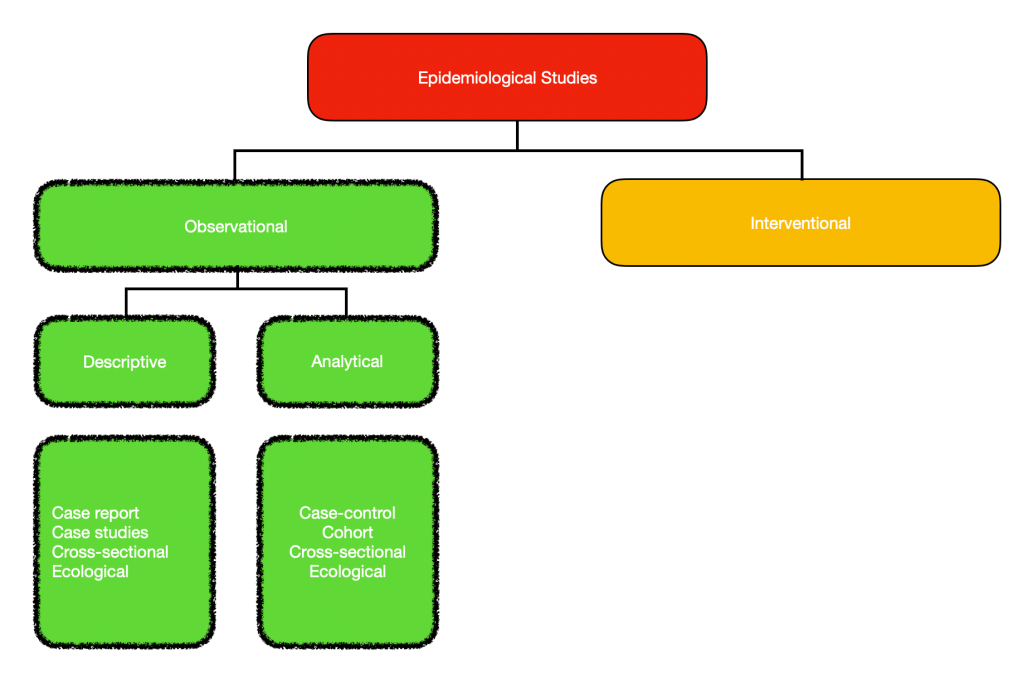
Observational studies consists of descriptive and analytical studies.
This can divided further into 6 different types of study designs.
I think the easiest way to approach this is to explain each type ending with the two that overlap – that is Ecological and Cross-sectional study. Hopefully, you will understand why by the end of the of this post.
Descriptive studies
Case Report These are usually common in medicine. It basically is an interesting or rare case that is written up for the purpose of letting other people learn more about it. It details the symptoms, signs, diagnosis, how we got to the diagnosis, management and follow-up. It is based on an individual scenario.
Case Series Can be thought of as multiple case reports , a collection of information or a group of people all of which are unified by a single exposure. For example, you have a number of patients given a particular treatment. You then review their records to establish the exposure and the outcome.
NOTE – Both case series and case reports are observational. What we see is literally what we write up and document. The exposures and outcomes are not controlled or augmented. Think of it as a journalist reporting on an event.
Analytical Studies
3. Case-control studies – remember here we have a hypotheses and we are testing it!
First of all we need to establish that in case-control studies we are looking back in time/retrospectively. We have our data and we establish two different groups. Our Case group consists of individuals with a particular outcome. Our Control group consists of individuals without the outcome. After establishing our groups, we look back on both and see how they differ in being exposed to a certain risk factor that we think contributes to the outcome. A classic example is the influenza virus and vaccinations. What are we trying to assess – whether vaccines reduce the chance of a person getting influenza.
Case – people with influenza Control – people without influenza What do we think is the reason they did not get ill in this instance? Vaccines!
Also, because it is retrospective it is relatively cheap and easy to carry out without losing patients to follow-up. However it tells us nothing about the incidence of the disease in the population and there might be some recall bias – as we look back in time.
4. Cohort studies
Cohort studies are carried out in the present. Once again you have two groups (let’s use the influenza example) one group who has been vaccinated while another has not. We then follow-up this group in real time to see who gets the influenza virus. What we are assessing is an outcome based on whether they were exposed to a risk factor. Another way of looking at this is the risk factor being the human papilloma virus (HPV) and the outcome being cervical cancer. So we essentially follow up these two groups to see how many from each group get cervical cancer and if there is a correlation to HPV infection.
Now, because this is done in real time it is not as easy or cheap to carry out. There is also a high chance of losing people to follow-up. However, it does tell you the incidence of a certain outcome in each group and there is less chance for recall bias.
Descriptive & Analytical
Ecological & Cross-sectional study
Now, the first thing you need to know, is that ecological and cross-sectional studies are very similar. They both basically give us a snapshot of a population at a point in time or over a certain period (ie a year). So what they tell us is the prevalence (how much of a disease there already is) at any given time/period of time. The defining difference is that ecological studies focuses on an entire population, while cross-sectional can be at a population level or a subset of it.
So when going over data, you will never see individuals in an ecological study but groups or aggregates of individuals based on things such as incomes, countries, age groups etc. While cross-sectional studies focus on the individuals.
These studies are both done in real time, and can be used to both test or generate a hypothesis therefore being both descriptive and analytical.
How?
An ecological study can be looking at the different income groups and their health at a given time and a cross-sectional study can just look at the people who have a particular disease at a given time. We just get the facts and learn about the prevalence of a certain disease. We then can generate a hypothesis and carry out an analytical study to test the association by doing either
If we were doing a descriptive study about chronic lung disease in Malaysia, we would look at all the states in Malaysia and gather info on which has the highest amount of chronic lung disease. But then we think, I wonder if the haze in South East Asia has an association with chronic lung disease? We then do an analytical ecological study, looking at the different states with chronic lung disease and their air pollution indexes. However, because it is an ecological study it really does not tell us anything about the individual, for all we know there could be other risk factors such as them smoking, having previous nasty chest infections etc.
For cross-sectional studies, a descriptive study would be a survey telling us the prevalence of hypertension in a population. All we have here is the how many people have the disease. Let’s say we think aging affects your chances of getting hypertension. We then look at people with hypertension and without hypertension and see if old age has a correlation. Here we have individual data instead of groups.
What is really important about both studies is that it only tells us about what cases are already there (prevalence) but nothing about new cases (incidence). It is because of this it doesn’t really help with studying cause and effect.
I know this is a ridiculously long post, but I hope it has been beneficial and I have managed to explain this as easily as possible. It did take me a couple of tries to wrap my head around it. Do leave me any feedback or thoughts, would love to hear from you!
One of the most important facets of public health is understanding epidemiological studies. I might also add that it is the one thing I repeatedly have to look over and a lot of my peers and colleagues find confusing and struggle with.
A quick recap of what epidemiology is – Put simply, it deals with figuring out the who, what, when, where, why and how certain diseases happen and telling us the way we can overcome/stop it.
Now epidemiology is actually made up of both Observational and Interventional studies, and to start we will talk about observational studies.
They are quite self-explanatory, as they are just that – observational. All we are doing is essentially just having an overall look. However, there are different ways to do this, and that is by being either descriptive or analytical.
So what are the main differences between these two types of research/studies we can carry out and what do we gain from it? I prefer the 5W’s and 1 H method of thinking about it.
Descriptive
Analytical
Who? What? When? Where?
Why? How?
So descriptive studies, look at an overall picture. It tells us what is going on, what is involved, who is involved, where it is happening and when without telling us Why or How. We basically go in without an idea for cause and effect. It essentially helps us identify them by examining patterns and by giving us an overall idea of the population, the distribution of health based on age, gender, location and time/over a period of time. It is from this, that we might identify a problem leading to ideas for new studies to figure out the why, how and perhaps even move on to an interventional study.
If let’s say I was selling chocolate and I wanted to know more about my customers, my initial descriptive study would tell me about the people who are buying my chocolates, where they live etc. I might learn, that only hipsters in their late 20’s buy my brand of chocolate but I still do not know why (well maybe because it’s unheard of?). My next task is to figure out why and perhaps how I can make my chocolate more appealing to different groups.
Examples of descriptive studies can be further broken down to cross-sectional study=ies like a health survey, ecological studies or even case reports/case series. Remember all it does, is present the facts for what they are and is a starting point for us to make associations and come up with new ideas.
Analytical studies then basically go into how this is happening and why? It is one of the ways to investigate causal relationships. So in these studies, I have a hypothesis/an idea. A health-related example would be that ‘smokers have a higher risk of lung cancer than non-smokers. We then investigate if this is true or not. How we go about this, is either with a case-control study, cohort study, cross-sectional study or an ecological study.
Something visual to help, the rest will be revealed as we move on.
How come cross-sectional and ecological studies are in both descriptive and analytical studies? Well, I will go into that when I talk more about the different types of studies mentioned in the next post.
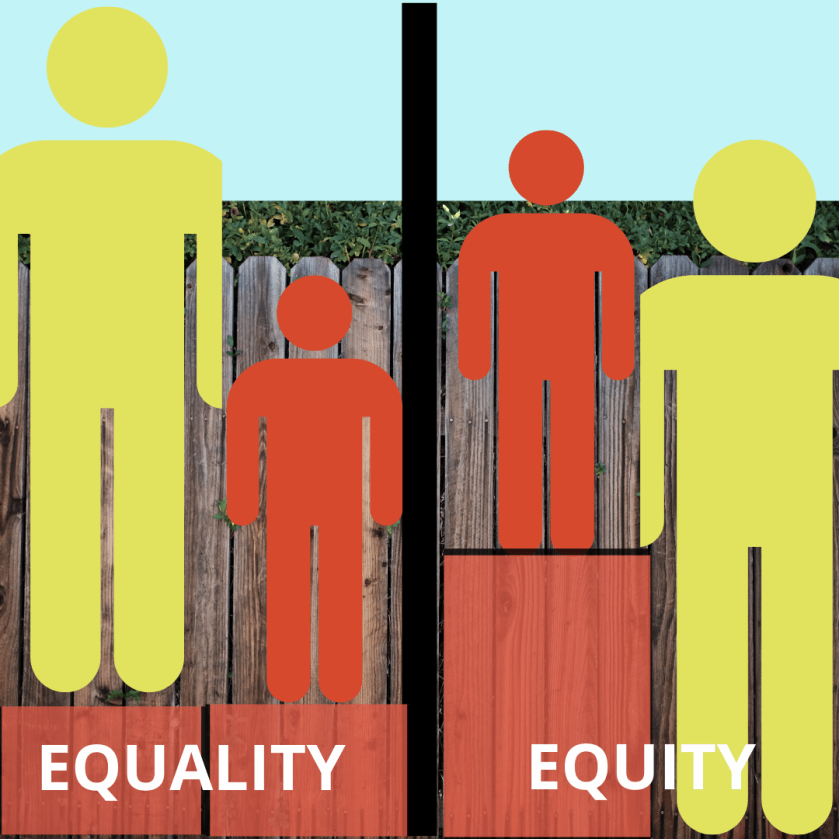
I have always thought of equality as important and a necessity. I do believe that everyone deserves to be treated as an equal – in status, rights and opportunities.
But the fact is, that most of us have different opportunities because we do not start off on equal footing. We all have our own set of advantages and disadvantages which give us a leg up compared to someone else.
It is because of this that equality is simply not enough in healthcare. While the idea of dividing already scarce resources evenly across the board sounds fair in principle, is it fair to say that a child born with Cerebral Palsy should get the same allocation (think funding in terms of healthcare) as one without CP?
As such we have Equity.
And in equity we look more at how resources are distributed as opposed to how we can get the most benefit from it.
Equity basically revolves around the principles of justice and fairness. This assessment of fairness is subjective. In equity we are going to say that more money should be given to the child with Cerebral Palsy because we can argue that to have the same quality of life as a child without CP they need more assistance, special equipment and that naturally incurs more costs.
This of course could be said to not be efficient.
So efficiency has many forms – from getting the most value for money, the most amount of output from a single input to reducing wait times in healthcare.
So which do we choose – equity, equality or efficiency? Here’s another example.
When I was in Sabah (Borneo), I worked in the main tertiary referral centre. While it was great and I learnt a lot, one of the biggest issues our patients had was in accessing healthcare because of costs, distance, lack of public transportation and the lack of equally equipped healthcare facilities close by.
While I can understand that concentrating all our efforts into one main centre is more cost effective, spreading it out and equipping other units to cope better would make my patients lives a lot easier.
Is it an efficient use of our resources? Probably not, but it sure would make me feel a lot better and in this scenario I think most of you would agree. Let’s go back to the child with CP though.
Now, if we did not practice equity and went on equality (everyone gets the same) would the argument then be that the child without CP would have an added advantage and therefore and even better quality of life?
Does this then make it more efficient as a whole? Or does the negative quality of life experienced by the child with CP who got less than they would if things were equitable, counter the ‘apparent advantages’ seen and we are right back where we started?
We now know what opportunity costs are and how that shows us our potential losses based on what could have been. And while that tells us where our money should go, there are still other factors to consider such as Margins and their costs and benefits.
Margins can be thought of as the next unit or a theoretical border. And Marginal Change is basically how change affects this “border” – either positively or negatively. So when weighing up decisions in healthcare, we look at marginal benefits and costs.
Marginal benefits = the benefit of one more unit of output Marginal costs = the cost of one more unit of output
And because I like silly anecdotes to help me remember things. I think of my friend who was very worried about fitting into her wedding dress. So if the marginal benefit of having a slice of cake is greater than the marginal costs, she proceeds to have a slice of cake – cause it is delicious! However, let us pretend that having that one slice of cake will mean she will no longer fit into her wedding dress and she does not have time to get it altered for the wedding. Then we could say here that the marginal costs outweigh the benefit of having that yummy slice of cake, so she decides she is not going to have it – cause although it is yummy, her wedding will be ruined because she won’t have a dress to wear.
What is this I hear about the Law of Diminishing Marginal Utility?
I think it is important to note that Utility here refers to satisfaction or happiness gained by the recipient.
That is a pretty interesting phenomenon. You know when you decide to dig into a pint of Ben & Jerry’s and that first mouthful is the best feeling in the world? But then you have more and more, and by the end of it you feel sick cause you are lactose intolerant and realise that it was a terrible idea to eat the whole pint of ice cream. (Or is this just me?) Now that is diminishing marginal utility – cause each extra unit of input yields less and less additional output/benefit. Essentially the benefit or the good diminishes as the consumption of it increases.
So, how does this work in healthcare.
Well marginal analysis – understanding the costs, benefits and diminishing marginal utility help us get the most bang for our buck really. It lets us know how well an intervention/screening programme or service is run as well as if it is worth investing more or further in it.
It also tells us when resources should be moved from programmes producing less marginal benefit per unit of cost to programmes producing more, as then the total benefit from the resources will increase.
The million dollar question is – Will spending more on healthcare truly show a benefit or are we going to experience the law of diminishing utility, where more money is pumped into healthcare but quality of life and overall satisfaction stagnates. Could the same additional funds instead be allocated to education or housing with better utility?
While I still do not know the answer to that question, I would love to hear your take on it.
So the question is what factors come into play when making decisions about what are the best possible interventions/actions we should take.
Opportunity costs is one of those factors.
In healthcare our main issues are
How do we get the best outcomes
How do we reach the most amount of people
How do we keep costs low or within the scope of the resources available
And this of course means we always have to make choices, and opportunity costs is one of the guiding factors in this decision making process. So what is opportunity costs?
It is basically the potential good outcome that is lost by the utilisation of resources or efforts in another area/intervention.
What on earth does this even mean?
The easiest way I understand this is in terms of hospital beds (in wards) and primary health care centres (outpatient/GPs).
So let us say we figure out that if one person is admitted in hospital, the same amount of funds could have been allocated to treating 15 people in a GP setting. So this is an opportunity cost because by having that one bed/admission, we lose the funds to treat 15 people in an outpatient setting.
And if I relate it to paediatrics, for every child admitted to ward requiring their parents to take time off work – that time spent in the hospital with one child also means a missed activity with other family/children or even wages lost .
Why is this important?
Because it shows us that requiring admission for treatment really should be a last resort and that it would be more cost effective if we could reduce the number of admissions.
So the next question is how do we figure out which is the best way to do that?
To Understand Health Services as they are today, we need to understand what has influenced them over the years. In our module we are given examples of 9 historical factors given that has shaped health services in the United Kingdom today.
These factors are :
1. Evolving understanding of illness 2. Technology 3. Socio-demographic changes 4. Social attitudes 5. Religion 6. Finance 7. Physical environment 8. War 9. Healthcare professionals
Being Malaysian and having worked in healthcare at home, I cannot help but think of what has affected and shaped our health service. Built on the backbone of our colonial history, Malaysia’s healthcare system is similar to that of the NHS. However, one of the most pertinent historical factors which I believe still plays a role today, would be culture, mythology and religion.
From visiting the local medicine man or “bomoh”, to the consumption of Chinese Herbs to balance out the hot and cold elements, to resorting to religious leaders in search of a cure through prayer and offerings. Malaysians have come very far in their understanding of illness and do seek medical attention at hospitals, yet these cultural practices have stood the test of time and while they mostly coexist quite harmoniously, I have unfortunately had to convince some of my patients that it might be best to hedge your bets and get the best of both worlds.
However it is these reasons as well that Mental Health is still a work in progress, as a lot of it is associated with being possessed by evil demons and spirits, to having being put under a spell.
An example would be ‘Amok’ or more contemporarily known as to run amok. Amok is actually listed as a syndrome in the Diagnostic and Statistical Manual of Mental Disorders. Described by Merriam-Webster as a sudden episode of mass assault by a single individual following a period of brooding. The belief behind it was that there was a hantu belian – tiger spirit that took over the person and caused them to act out in that manner. These beliefs still persist till this day and are only some of the barriers left to overcome in addressing Mental Health issues in Malaysia. What about your country?
Can you identify with any of the 9 historical factors listed with regards to what has your country’s current healthcare services? Please do drop me a line in the comments, would love to hear about them.