When I think of research, I automatically think of scientific research.
So if I were to describe it, I would say it is based on facts, backed up by evidence, as being precise and above all objective.
How about social research though? Would I describe that the same way?
When this question was first put forth, I realised that I felt it was more subjective.
I felt in social research the questions and answers were more open to interpretation, would depend on the mindset/view point of the person conducting the research as well as the approach taken.
But then again, can the same thing not be said about scientific research? Is it naive to think that none of that takes place as well?
What do you think?
P.S – I swear I am going somewhere with this, more to come in the next post.
They have the highest GNI per capita in the world.
Let’s take a step back though, the first thing we need to understand is economic growth.
Economic growth is when we see an increase in the goods/products/services produced over a period of time. It is good to note that it is inflation adjusted.
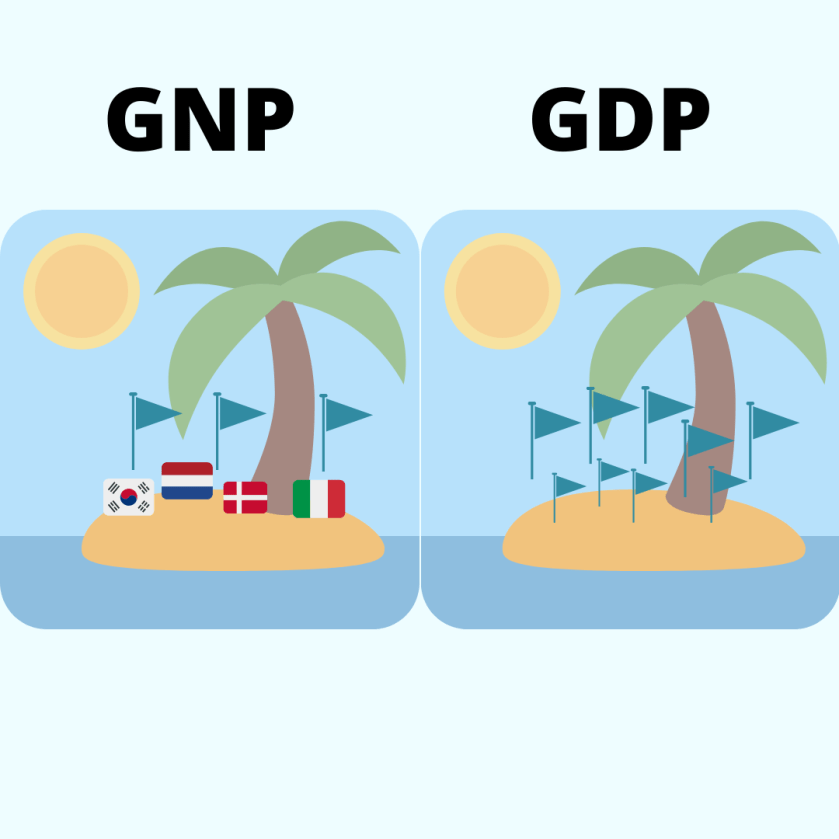
So GDP or Gross Domestic Product is how we measure it. Basically it tells us the output or production of a country, regardless of who has made the product. This tells us how healthy the economy is but does not really clue us in into the financial well being or wealth of the people or the country itself.
GNP is Gross National Product which is the same as Gross National Income. Regardless of which term you choose, the concept is the same. Both measure the production/income of a country and all it’s people, regardless of whether it is within their borders. Think of GNI as GDP + salaries and other incomes of the country’s residents earned abroad.
For example Amazon is a US based and owned company, although it is operating in the UK/Malaysia/*insert country of choice* it contributes to the GNI/GNP of the United States while contributing to the GDP of the UK.
But how does that help us understand the wealth/well-being of a country? Surely Amazon is not a reflection alone of the USA being a wealthy country?
Hence we have GNI/GNP per capita which is essentially the average income of a country. We take the entire income by people from/in the country and divide it by the total population. This allows us to draw comparisons between different countries regardless of population size and tell us what their income is which is used by the World Bank to classify countries into low, middle and high income countries.
However, this does not reflect the economic situation of a country as it is the average and as we are all too familiar with, wealth is not distributed equally across the board. Therefore it says nothing about the standards of living for the entire population involved. For this reason, it cannot be used on its own.
So how do we overcome this and get a better idea of what is going on in each country? More in the next post.
In the last post we talked briefly about both Incidence and Prevalence.
Quick recap
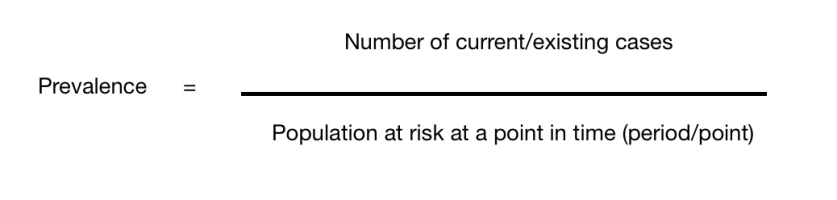
Prevalence is the number of incidents/cases/chocolate that are already in the population/box of chocolates at that point in time.
Occasionally it is called Point Prevalence. This is to let us know that the prevalence is being measured over a single point if time, versus a period of time (weeks – months)
Period Prevalence – Prevalence measured over weeks/months
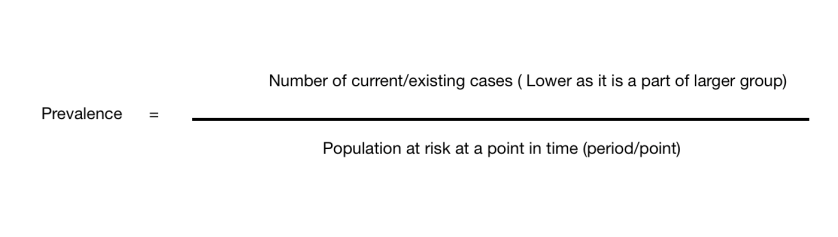
Given that prevalence represents a part of a whole group, it can never be more than 1 when expressed as an equation.
Prevalence is basically a useful tool in giving us an initial idea of the extent of a disease/outcome. However if does not tell us how many new cases take place, how often this particular outcome happens, how long the disease/outcome lasts and what the risk factors are.
Given that it is election time that will be my example.
So Blythe Valley typically was a Labour safe seat. And the labour party held a majority based on the last election (point of time). However, this does not take into consideration the new voters who voted Conservative or the people who changed their mind and voted Conservative in this election.
When talking about frequency we consider it in two ways, namely prevalence and incidence.
Prevalence – Is the number of known cases at a given point in time Incidence – Is the number of new cases in a population over a specified time
Why is this significant? I like to think of it as a box of chocolates.
Out of this box of chocolates that I am using for our Christmas party, my favourite is the purple one – the awesome hazelnut and caramel filled milk chocolate. So my Prevalence in this instance would be all the purple chocolates I have at that particular point of time in said box of chocolates. I do not take into account the amount of chocolates that might be eaten during the Christmas party, gotten rid of because the wrappers were ruined nor do I consider the fact that perhaps some other kind souls would bring me more chocolate to contribute to the sweet bowl. All it tells me is the amount of purple chocolates present out of the 48 chocolates currently available.
My Incidence however, is the hope that some kind soul will bring more chocolates to said party and the potential new purple chocolates that might be added to the sweet bowl. I do not consider the amount of chocolates that have been eaten, those with ripped packaging that have to be put aside or removed cause no one likes them (here’s looking at you coconut cream). I just look at the potential amount of new purple chocolates that might be present over the total number of chocolates in hand.
However there is a lot more to incidence and prevalence and we will discuss it in the next few posts.
Measuring disease and health outcomes, Part 2 – Population
As mentioned in part 1 understanding frequency alone can be misleading – which is why we need to know our population.
The fact is that health outcomes can differ for a variety of reasons. From different countries, regions, socio-economic backgrounds and even time. Therefore to study an outcome we first have to clearly identify who we want to include – this is our Target population.
Our target population is basically the individuals we want to identify or whose health we want to improve. For example being concerned about the population of Hull City. However if we were to look at the all 200,000 people in Hull City – we would probably be overwhelmed as realistically it would be too difficult to gather and quantify all that data.
To make things easier we identify a Study Population. And this would be a smaller subset of individuals with a particular disease/health outcome we would like to study. For example the study population would be the number of individuals over the age of 30 who are diabetic. If this sample is too large – lets say 50,000 individuals, then an alternative method of collecting information is needed. Which is why we use a Study Sample, which is a smaller number of the Study Population, selected at random to represent the 50,000 individuals.
Target Population = Individuals in Hull City Study Population = Diabetics > 30 years of age living in Hull ( eg = 50,000 identified) Study Sample = 2000 individuals chosen at random from the 50,000, to represent the diabetics over 30 years of age.
Why do we need to define our populations?
So we know who are the population at risk. These are individuals who have the risk factor for the condition being studied regardless of whether they are currently healthy or ill. This can be clear cut or vague depending on what is being studied.
For example, if the population at risk for developing lung cancer is smokers, they are clearly identifiable cause we can assess smoking histories. But in some instances such as rare diseases we cannot always identify who is at risk for a variety of reasons. In these instances we use the whole population as an estimate.
So once we identify the population, we can figure the frequency of an incident taking place. Ie if there are 500 cases of lung cancer out of a study population of 4000 smokers(population at risk), then we know the frequency is 1/8.
But let’s say we only have 2 researchers and 4000 is too large a group to manage, this is when we use a study sample. So 1000 smokers are identified at random to represent the 4000. Out of the 1000 smokers, we find 120 cases with lung cancer. The frequency in this instance would still be 1/8 or 120 per 1000 cases. Which when compared with the study population would still give you 500 cases of lung cancer out of the total population at risk of 4000 smokers.
In the next post, we will talk about how we can express frequency – incidence vs prevalence.
Measuring disease and health outcomes, Part 1 – Frequency
How do we measure how often a particular disease happens in a population? How do we identify which diseases are more far-reaching or have the worst outcomes? How do we decide at what level we should intervene?
By knowing the frequency.
Frequency guides us by telling us how often an event happens in a particular population over a specific time. It helps us understand how a disease affects a population or rather the health outcomes by measuring it.
To do this we have to clearly identify what we are looking for and this is called a case definition. This is because not all health outcomes or diseases are black and white, therefore having a clear cut-off point helps us measure how many people are affected by it. For example, if we want to see how many obese people are in a community our case definition would be to look for people with a BMI > 30. It can go beyond clinical issues such as looking at the number of people over the age of 60 who had fallen in the last month. In the latter, the case could occur once or even more than that.
Basically by getting a clear definition. We are able to identify the individuals in the population.
However, knowing the frequency of an event can be misleading as population size can affect our perception of it. For example, if I said there were 200,000 known diabetics in London and 50,000 in Hull City. You would think that Hull had fewer diabetics, right? Now, what if I told you that the population of London is 8 million people while Hull only has 200,000 people. Does that change your mind?
This is why we need to know the population and identify the population at risk.
When we think about the healthcare system, there is often one aspect of care we do not talk about – YOU!
The fact is that every individual plays a rather significant role and I don’t just mean in terms of a being a recipient of healthcare services, a patient or working as a trained healthcare professional. I mean everyday people providing an element of service.
This is known as lay care.
It basically consists of self care, caring for a family member, giving advice, sharing information, emotional support and even volunteering. In fact it accounts for about 80% of all care and is rooted in every form of formal healthcare.
From the time we were children from our parents looking after us when we are ill, asking for advice from family and friends when we have any health issues, seeking over the counter pain relief to making the decision to go into hospital – all these are forms of lay care. Another big aspect is from volunteers providing a listening ear and emotional support to carers looking after the elderly/disabled/sick children. It must be mentioned that in most contexts, it is unpaid care/work.
As an intern in the Geriatric ward in Sabah, I recall not always being able to discharge medically stable inpatients. Why? Because they were unable to care for themselves nor were their families equipped to do so. This led to prolonged hospital stay, additional costs and a whole set of issues for the carer such as potential loss of income, issues at work and additional stresses to the individual. Thus begging the question of what services may need to be made available to address these needs and at a higher level perhaps even policies.
Why is it so important for formal healthcare to understand the reach of lay care?
It’s important because it is supplementary to formal healthcare at all levels. It gives us insight into the understanding of illness in the community, when people will seek healthcare, who they are comfortable seeking it from, as well as how changing times and socio-economics is causing a shift in the ability of ordinary people to provide care. This information is crucial in designing our healthcare services, identifying areas we need to improve on and expanding services accordingly.
I would love to hear about your experiences in providing lay care or where it is being provided. Do you think this has changed over time or do you see it changing? What do you think could be done in those instances.
Remember that iconic scene in the matrix where Morpheus asks Neo to choose the red pill or the blue pill? That’s how I like to think of RCT’s.
Basically the researcher is “Morpheus” and the study subject is “Neo”, but instead of just 1 Neo choosing the red/blue pill we have a few. Each Neo is randomly assigned either the red or blue pill. Morpheus then sits back and watches what happens to the Neo’s and we see by the end of it who is more content – the Neo living life in blissful ignorance in the Matrix or the one steeped in reality.
Which is basically what RCT’s do. They assess how different interventions/treatments affect two different groups by following up participants. When done well, it provides the best evidence on the cause and effect relationship by studying it in real time. (temporal sequence)
There is an experimental group given the intervention/treatment (Neo leaving the Matrix) and the comparison group (controls) that gets a placebo or the current conventional treatment (Neo in the Matrix). They are then followed up to assess how effective the new intervention/treatment is in comparison to the current standard/placebo group. (Is Neo more content out of the Matrix or in?)
However unlike Neo in the Matrix, there is no choice involved and the individuals involved are randomly assigned.
Why? To avoid any selection bias by the testers choosing individuals who may have better outcomes and to ensure that both groups are as similar as possible therefore being able to distribute the confounding factors.
What are confounding factors? It is basically any other variable that can affect your dependent variable.
For example, if we are doing a study on a sedentary lifestyle causing weight gain. The independent variable here is the sedentary lifestyle while the dependent variable is weight gain. And the confounding factors can be anything from stress, diet, food portions, genetics and metabolism – all of which can affect weight gain (dependent variable). The hope is that by randomising it, we will get an equal amount of these other confounding factors in every group therefore giving us a clearer picture on the intervention being studied.
Despite being the best method, RCT’s still has some short-comings. They tend to be expensive, time consuming and you could argue that if a person is in an RCT – they are probably more likely to be compliant therefore not really giving us a real world experience.
Today, as I clicked and read posts on World AIDS Day all across social media and the news, I realised that while it is part and parcel of my training to know about HIV/AIDs and the clinical aspects of it. I realised I did not know nearly enough about the history and how we have progressed over the years especially in public health terms.
So, I spent most of the day reading up on it.
What I have come to learn is that unlike many other epidemics or diseases, we as human beings could have dealt with this better. The WHO states that ‘Fear, stigma and ignorance’ were the main drivers of this disease. While I cannot blame fear at the very beginning because we lacked knowledge, information and we were driven by the fear to survive. Our failings came to the forefront when we identified the groups at risk and it being spread by sexual contact.
Essentially stigma stopped us from being able to apply the usual standards of disease control. It is appalling to think that fear, stigma and the ability to assign some form of fault/prejudice were such driving forces that we had to change our approach.
Thankfully, things have changed and we are at a point in time where there is a commitment globally to end it as a public health threat by the year 2030. The methods being used are improving identification by expanding testing, simplifying treatment as well as monitoring and of course pushing for prevention which has been demonstrated by ’low-income countries’ to be effective. One such example is how Ugandans have managed to half the rate of infections over a ten-year period by pushing for education and prevention methods.
While, there is still a lot to do. I think my take home message while not strictly a pubic health one today – is that we as people need to try hate a little less and not be afraid of difference. Perhaps things could have been easier if we as human beings could believe that regardless of circumstances everyone had the right to life.
I have linked some of articles below if you would like to have a read.
In my last post, I talked about what descriptive and analytical studies are. I also mentioned what types of studies fall under these two categories.
Always easier to visualise. No?
So quick recap
Observational studies consists of descriptive and analytical studies.
This can divided further into 6 different types of study designs.
I think the easiest way to approach this is to explain each type ending with the two that overlap – that is Ecological and Cross-sectional study. Hopefully, you will understand why by the end of the of this post.
Descriptive studies
Case Report These are usually common in medicine. It basically is an interesting or rare case that is written up for the purpose of letting other people learn more about it. It details the symptoms, signs, diagnosis, how we got to the diagnosis, management and follow-up. It is based on an individual scenario.
Case Series Can be thought of as multiple case reports , a collection of information or a group of people all of which are unified by a single exposure. For example, you have a number of patients given a particular treatment. You then review their records to establish the exposure and the outcome.
NOTE – Both case series and case reports are observational. What we see is literally what we write up and document. The exposures and outcomes are not controlled or augmented. Think of it as a journalist reporting on an event.
Analytical Studies
3. Case-control studies – remember here we have a hypotheses and we are testing it!
First of all we need to establish that in case-control studies we are looking back in time/retrospectively. We have our data and we establish two different groups. Our Case group consists of individuals with a particular outcome. Our Control group consists of individuals without the outcome. After establishing our groups, we look back on both and see how they differ in being exposed to a certain risk factor that we think contributes to the outcome. A classic example is the influenza virus and vaccinations. What are we trying to assess – whether vaccines reduce the chance of a person getting influenza.
Case – people with influenza Control – people without influenza What do we think is the reason they did not get ill in this instance? Vaccines!
Also, because it is retrospective it is relatively cheap and easy to carry out without losing patients to follow-up. However it tells us nothing about the incidence of the disease in the population and there might be some recall bias – as we look back in time.
4. Cohort studies
Cohort studies are carried out in the present. Once again you have two groups (let’s use the influenza example) one group who has been vaccinated while another has not. We then follow-up this group in real time to see who gets the influenza virus. What we are assessing is an outcome based on whether they were exposed to a risk factor. Another way of looking at this is the risk factor being the human papilloma virus (HPV) and the outcome being cervical cancer. So we essentially follow up these two groups to see how many from each group get cervical cancer and if there is a correlation to HPV infection.
Now, because this is done in real time it is not as easy or cheap to carry out. There is also a high chance of losing people to follow-up. However, it does tell you the incidence of a certain outcome in each group and there is less chance for recall bias.
Descriptive & Analytical
Ecological & Cross-sectional study
Now, the first thing you need to know, is that ecological and cross-sectional studies are very similar. They both basically give us a snapshot of a population at a point in time or over a certain period (ie a year). So what they tell us is the prevalence (how much of a disease there already is) at any given time/period of time. The defining difference is that ecological studies focuses on an entire population, while cross-sectional can be at a population level or a subset of it.
So when going over data, you will never see individuals in an ecological study but groups or aggregates of individuals based on things such as incomes, countries, age groups etc. While cross-sectional studies focus on the individuals.
These studies are both done in real time, and can be used to both test or generate a hypothesis therefore being both descriptive and analytical.
How?
An ecological study can be looking at the different income groups and their health at a given time and a cross-sectional study can just look at the people who have a particular disease at a given time. We just get the facts and learn about the prevalence of a certain disease. We then can generate a hypothesis and carry out an analytical study to test the association by doing either
If we were doing a descriptive study about chronic lung disease in Malaysia, we would look at all the states in Malaysia and gather info on which has the highest amount of chronic lung disease. But then we think, I wonder if the haze in South East Asia has an association with chronic lung disease? We then do an analytical ecological study, looking at the different states with chronic lung disease and their air pollution indexes. However, because it is an ecological study it really does not tell us anything about the individual, for all we know there could be other risk factors such as them smoking, having previous nasty chest infections etc.
For cross-sectional studies, a descriptive study would be a survey telling us the prevalence of hypertension in a population. All we have here is the how many people have the disease. Let’s say we think aging affects your chances of getting hypertension. We then look at people with hypertension and without hypertension and see if old age has a correlation. Here we have individual data instead of groups.
What is really important about both studies is that it only tells us about what cases are already there (prevalence) but nothing about new cases (incidence). It is because of this it doesn’t really help with studying cause and effect.
I know this is a ridiculously long post, but I hope it has been beneficial and I have managed to explain this as easily as possible. It did take me a couple of tries to wrap my head around it. Do leave me any feedback or thoughts, would love to hear from you!